![Understanding Comics book cover; Scott McCloud]() Comics and Visualization
Comics and Visualization
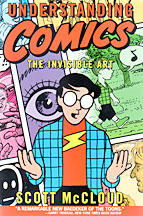
Although this book is over a decade old now (and Scott has a number of later books that follow on from this one), this is still a highly valuable book to read, getting great review from famous artists as a fundamental resource for comic book writers. I read this from the perspective of a visualization expert, and found a number of interesting points in the book, especially the earlier sections. He defines comics as “juxtaposed pictorial and other images in deliberate sequence, intended to covey information and/or to produce an aesthetic response in the viewer (p.9)”, which, to my mind, allows many visualizations to fits his definition! The concept of small multiples, when presented in a “deliberate order” such as via a trellis display, fits particularly well into this definition, so I was encouraged to read on. Some highlights of the book, from my point of view:
- The use of simpler icons / symbols to make depictions of reality more universal; that argument resonates more strongly with me than Tukey’s data-ink concept. I feel more convinced by the argument that additional detail is bad when it makes it harder for us to understand the high-level picture because it draws us too much into the physicality of the shapes being used.
- McCloud presents a triangular space, the vertices of which are “reality”, “language” and “the picture plane” into which comic styles can be placed. I think there is also value in looking at various styles of visualization and seeing where they fit in. Treemaps, for example, have more “realistic” versions using cushions, while keeping the same structure. Scientific, geographic or fluid display visualizations are more realistic than, say, statistical graphics.
- “Less is More” applied to the number of intermediate representations used — this argues that for visualizations of, say, a process evolving over time, we should not simply slice at even times, but instead look for important features we want to show, and show fewer frames.
- Lots of good stuff on how time is perceived when displayed at a sequence.
- “Can Emotions be Visible?” is the motivating question for chapter five — I would be very curious to see if we could apply his ideas to visualizations — maybe people like pie charts because they seem warm, serene and quiet, whereas a line chart with gridlines is rational, conservative and dynamic?
As an aside, I included a comic in my book on Visualizing Time, more as a whimsy than anything else, but I’m glad that I have at least a tenuous link with Scott McClouds’s highly recommended book! 


